 |
|
Topics
|
Island Climate NOAA’s National Weather Service operates a station twenty-four hours a day, every day of the year on St. Paul Island. From 1949 to 2005, the average annual maximum temperature on St. Paul Island was 39º Fahrenheit (F); August was the warmest month with an average maximum temperature of 51.5º F (WRCC 2006; see table below). For the same period, the average annual minimum temperature was 30.9º F; February was the coldest month with an average minimum temperature of 18.8º F. Between 1971 and 2000, the highest average monthly maximum temperature of 55.1º F occurred in August 1993, and the lowest average monthly minimum temperature of 13.6º F occurred in February 1984.
The average total annual precipitation on St. Paul Island from 1949 to 2005 was 23.67 inches (in.), with the most rain (3.10 in.) falling in August on average. The average total annual snowfall was 56.2 in., with snowfall beginning in October and continuing as late as June. The highest average monthly snowfall occurred during December (9.8 in.) and the highest average snow depth occurred in March (7 in.). This data from the National Weather Service can be compared with early twentieth century accounts of the Pribilof Islands’ weather and climate. Wilfred H. Osgood, et al., (1915, 18) wrote:
In the 1920's, G Dallas Hanna offered the following observations:
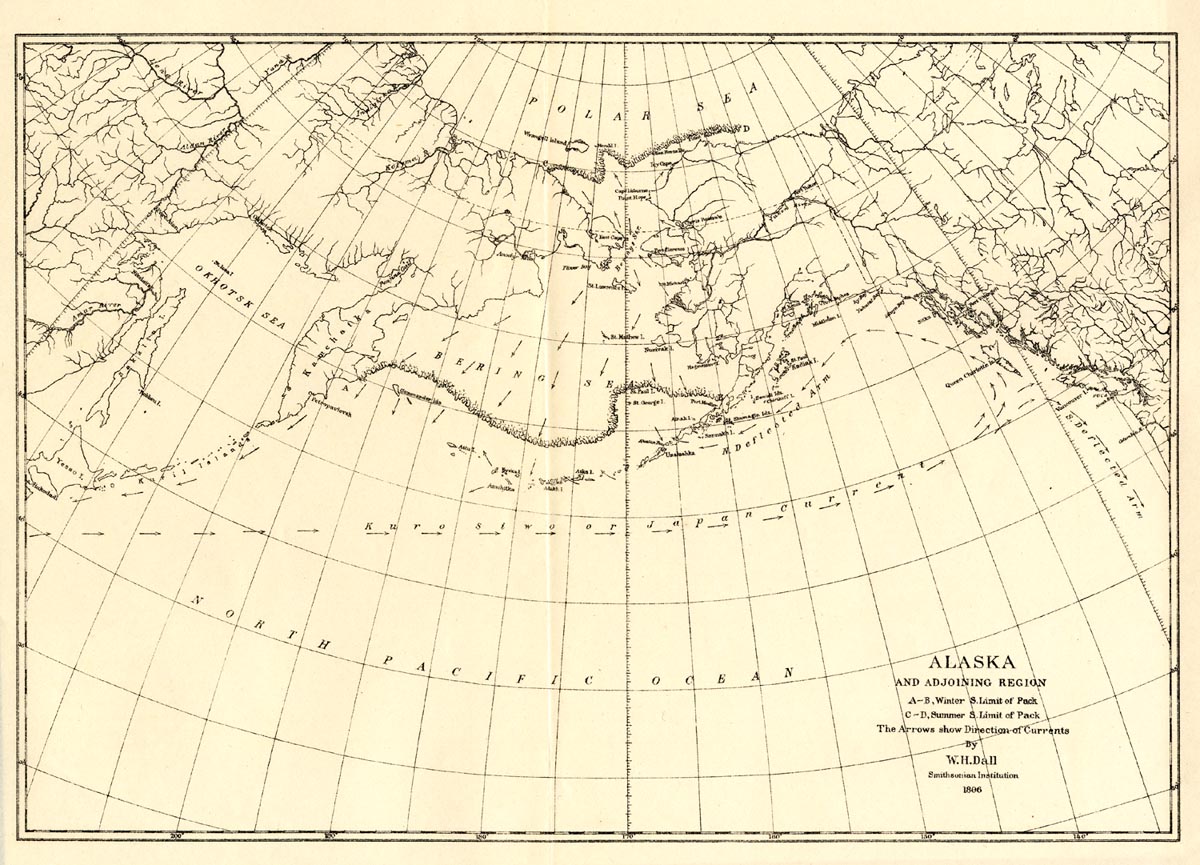
Sea ice reached St. Paul Island and St. George Island in March 2007 and January–April 2008. It reached St. Paul Island during January and February 2006, April 2005, January and February 2002, March 1999, and April 1997 (Page 2006, pers. comm.; Blizzard 2006, pers. comm.). The writings of Osgood et al. (1915, 18) and Hanna (2008, 246) suggest sea ice (drift ice) was more common in the early twentieth century than today. Osgood et al. (1915, 172) indicated that ice pack “frequently closes in about the shores.” Hanna (2008, 248) stated, “Drift ice usually visits the islands every winter. The time of arrival has been from the first of January to the last of March and it may stay a few days or a few months. Rarely has it been known to remain as late as June 15.” W. H. Dall provided a map of the 1896 winter and summer southern limits of ice pack in the Bering Sea (Dall 1899, 539–546). The effect of sea ice on surface water temperatures during late spring and summer appear in part, related to the occurance and density of fog at the Seal Islands. St. Paul Island, Alaska Monthly Climate Summary: 9/1/1949 to 9/30/2005
Source: Western Regional Climate Center (2006).
|
 |
NOAA created this product in partial fulfillment
of a memorandum of agreement between it and the Alaska State Historic
Preservation Officer. |